
RP 7: Traditional Math: Graphing Proportional Relationships
Seventh Grade

I once remarked to a fellow math teacher that I hated the chapter on graphing proportional relationships. “I always have students who are confused by the whole thing,” I said.
She agreed. “All I do is show that the graph of a proportional relationship is a straight line and goes through the origin.”
And that’s how I’ve approached it, and that’s what I will describe here. Some textbooks include linking it to slope and that the slope is the same as the constant of proportionality, and that the formula y = kx (discussed in the previous chapter) represents what is called direct variation. Slope is discussed in the unit on linear relationships, and like the unit on proportions it should be kept simple. Also discussed in the linear relationships unit is dependent and independent variables, which is mentioned briefly and succinctly in this lesson.
Warm-Ups. The problems provide review of what happened in previous lesson, as well as including a two step equation with fractions.
1. A garden has tomato and pea plants. The ratio of tomato plant to total plants in the garden is 7: 20. What is the ratio of tomato to pea plants? Answer: 7:13
2. Complete the table. Admission to an amusement park is $4 plus $1.50 per ride.
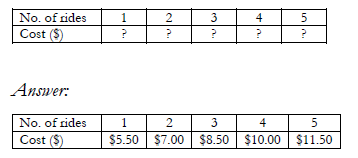
3. Is the relationship shown in Problem 2 proportional? Why or why not? Answer: No. 5.50/1 ≠7/2 and so on.
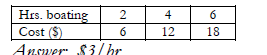
4. What is the constant of proportionality for the relationship below?
5. Solve. (3/4)m -2/9 = 5/18 Answer: (3/4)m = 5/18+4/18; (3/4)m=9/18=1/2
m=1/2 × 4/3 = 2/3
For Problem 3 students can easily see that the ratios are not equal, so the relationship is not proportional. For Problem 5, it is evident that the ratios are equal. Unit rate should be expressed as $/hr, rather than hr/$, although either way will produce equal ratios. It is worth mentioning that the $/hr would be the more logical presentation of unit rate, since cost is dependent on the hours spent boating.
Graphs and Proportionality. The warm ups went over proportionality using tables. This lesson focuses on how graphs can determine whether a linear relationship is proportional or not. Students have been introduced to graphing in sixth grade, and perhaps even in fifth grade. The conventions of x and y axis, and displaying ordered pairs as (x,y) might need to be reviewed at some point in this lesson as a reminder/review. Assuming that this is known, I start with two graphs as shown below:

I will ask students if the ratios between cost and the number of guests is constant in the first graph. Hearing “yes”, I ask them to look at the second graph and tell me. It becomes obvious that they are not.
I point out that in the first graph, the straight line passes through the origin. “What about the second graph?” It is easy to see that it does not. This brings us to the main and only rule of this particular lesson:
If the graph of two related quantities is a straight line through the origin, then the two quantities are proportional. If it does not pass through the origin, the two quantities are not proportional.
I point out that a convention followed in tables of values, is that the second row of values represent items that are dependent on the values in the first row. We call the values in the second row “dependent variables”—that is, their value is dependent on the values in the first row. The values in the first row are called “independent variables. When graphing, the first row of values are the x-coordinates on the graph, and the second row of values are the y-coordinates. (Again, assuming they are familiar with the convention of the x-axis being horizontal and the y-axis being vertical). This is repeated again in more detail later in the unit on linear functions.
Examples. For the examples, I have students graph in their notebooks. (I use graph paper notebooks.)
Example: Determine if the cost of the tickets is proportional to the number of tickets.
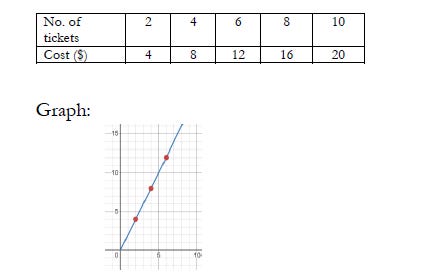
What is the unit rate? Answer: $2/ticket
Other examples are similar to this.
Analyzing Proportional Relationships. Textbooks usually include a section on analyzing proportional relationships, in which the focus is on interpreting what the relationship is telling us. They will often also say something along the lines of “The point (1,y) tells what the constant of proportionality or unit rate is.” This is fine if the graph neatly passes through the x-coordinate of 1, but sometimes it will not, in which case students will need to find the constant of proportionality or unit rate by dividing any y-value by its corresponding x-value—providing the relationship is indeed proportional. And that is determined if all the ratios in a table or graph are constant.
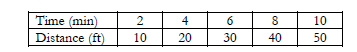
Interpretation of the proportional relationship is tantamount to “explaining” what the relationship represents. Students dislike being told to “explain” what something means, so it is necessary to show them what it means, and how to do so. The following example show the distance travelled in feet for various times in minutes.
The analysis follows these steps:
Is it proportional? How do you know? Yes, the ratios are constant.
What is the unit rate? 5 ft/min
Interpret this unit rate: 5 ft is travelled for each minute
Explain what the points (0,0), (2,10) and (6,30) mean: The point (0,0) represents 0 ft travelled when no travel has occurred.
The point (2,10) represents 10 feet travelled in 2 minutes. The point (6,30) means 30 ft travelled in 6 minutes.
Example: I work through another example having students supply the answer and then give one more for them to work on their own.
The number of pounds of walnuts in a nut
mix is proportional to the numbr of pounds of peanuts as shown in the graph.

Find and interpret the constant of proportionality.(Answer: The graph shows the value at x as 0.04, so the unit rate is 0.04/1, which is the constant of proportionality.)
Explain what the points (0,0), (1,0.4) and (7.5,3) represent. (Answer:; The point 0,0 means that there are 0 pounds of walnuts when there are no peanuts. The point (1,0.4)means that there are 0.4 lbs of walnuts when there is 1 lb of peanuts. The point (7.5, 3) means there are 3pounds of walnuts when there are 7.5 lbs of peanuts.)
Students generally find these difficult at first, but upon seeing the pattern, they catch on to it. I don’t dwell on this particular unit, as I’ve said, but because it will be part of state testing, I include it.
Homework. Problems are similar to those given above. I reiterate that graphs for which a straight line passes through the origin represents a proportional relationship. If it doesn’t pass through the origin, it is not proportional