
LE 5 Traditional Math: Constant Rate of Change and Slope
Accelerated seventh grade and Math 8

The previous two lessons provide methods for graphing equations. At this point it may be helpful to give students the big picture of where this is all heading. The first lesson shows how functions that are linear use a rule to assign output values to input values. This was done using a table of values, resulting in ordered pairs that were then plotted, and a straight line was drawn to connect them. The second method was more of a short-cut, and illustrated what x and y intercepts are. It also introduced the standard form of a linear equation.
In this lesson we look at what the graph of a linear equation represents in terms of slope. The basic message is that slope represents a constant rate of change, whether it be distance over time, cost of fruit per pound and so on. The initial introduction of slope provides the foundation for the concept of rate of change, that will continue to be built upon in subsequent math courses. For some students, it will start to sink in more during algebra. At this point it is more mechanical than what it represents, though both are covered. What students take with them is how the slope of a line is calculated, and later, how the slope is used to find the equation of a line.
Warm-Ups. These contain concepts about equations but also a problem about averages which students will find challenging.
1. The function f(t) = 40t represents the distance traveled at 40 mph for t hours. What is the independent variable in this function? Answer: t is the independent variable.
2. What are the x and y intercepts for the equation y-2x = -2?
Answer: x-intercept: -2x = -2; x = 1; (1,0) y intercept: y=-2; (0,-2)
3. Maria has averaged 88 on her last three tests. What does she need to average on her next two tests to have an overall average of 90? Answer: Total score for last three tests: 3 × 88 =264. Total score for all five tests: 90×5 = 450. Score needed on next two tests to reach 450: 450-264 = 186. Average of the last two tests: 186/2= 93.
4. Complete the table of values for y = 2x

5. Complete the table of values for y = 3x

Problem 3 will be the most challenging of all of them, and students will likely need hints and guidance for solving it. Prompts include: “What would be the total points for the three tests? How do you figure that out? How about for all five tests? How do those totals help you?”
Wind-Up: Rate of Change. Problems 4 and 5 of the Warm-Ups are a direct lead-in to the day’s lesson. After going through it, I provide further details.
“Suppose for the first table, the function represents a remote control car that travels 2 inches per second. And for the second table, we have a remote control car that travels 3 inches per second. The x values represent seconds, and the y values represent inches. For the first car, how many inches does it travel in the first second?”
The answer, of course, is 2 inches.
“How many for two seconds?”
The answer is 4 inches.
“And if we look at the difference in inches traveled for each second, how much does the distance increase?”
The answer is 2.
“Let’s write the ratio of the change in distance over the change in time. How far has it traveled in 4 seconds?” It’s traveled 8 inches, so the ratio would be 8/4 which I have them simplify to a unit rate: 2 in/sec.
“Now let’s find the change in distance from 2 seconds to 4 seconds. What is that change?” The change is 8 – 4 or 4 inches. The time elapsed is two seconds. “What is the ratio?”
I should hear 4/2, which I have them simplify again: 2 in/sec.
I do the same thing for the second table in which the unit rate always comes down to 3 in/sec.
I write on the board and have them copy in their notebooks:
For linear equations, equal changes in x produce equal changes in y.
“Now let’s graph each one, and put the graph of each one on the same set of axes.” I have them do this in their notebooks and circulate through the class. The graphs should look like these:

“If you picked any two points on one of the graphs, you’d find that it is always the same number, which is what you just wrote in your notebooks. An equal change in x results in an equal change in y. In other words, linear equations have a constant rate of change.”
“Which line would you say is steeper?” There will be a general consensus that the 3 in/sec line is steeper.
“What these lines represent is a change in rate. The 3 in/sec line is steeper than the 2 in/sec line. It’s covering more distance for the same amount of time. We call that measure of steepness the ‘slope’ of the line.”
Possible Confusion:
Observant students might notice that for the equations used in the example, one obtains 8 inches in 4 seconds which simplifies to 2 in/sec, and also obtains the same ratio by finding the change in difference of distance for the difference in time as we did. That is (8-4)/(4-2) is the same as 8/4. The student will ask “So isn’t the change always going to be the y value divided by the x value?”
The answer is that it will for proportional equations which we discussed in a previous lesson. Equations that are proportional will have constant y/x values, and the line will go through the origin. I explain that we will see what happens for non-proportional equations in a few minutes.
This will satisfy the person who asked the question; there is no need to dwell on it. One could say I am differentiating instruction to the specific question rather than forcing the entire class to dwell on the distinction that I feel could lead to information overload. In a subsequent lesson, the topic of proportional equations and direct variation is addressed.
The Pitch: Slope. Having just defined slope as the rate of change for a linear equation, I have become aware over the years that these are words that make more sense the more experience they have with graphing. Right now I focus on the foundations of what slope is, and how to calculate it.
“Slope tells us how much something changes, and the graph shows us this by vertical distance, which is called the ‘rise’, compared to the horizontal distance, called the ‘run’. Slope is sometimes called ‘rise over run’ or vertical distance over horizontal distance. You’ve seen it when you travel and there’s a sign that says ‘15% grade’. That means that for every 1 foot it rises 0.15 feet. So how much does it rise if you go 100 feet?”
I will generally get one or two people who volunteer the answer of 15 feet.
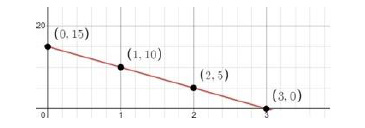
I describe another situation: A bottle that contains 15 gallons of water and leaks at the rate of 5 gallons per minute. I show them a graph that illustrates this.
“Here’s the procedure that applies to any graph of a linear equation.” I write the steps on the board and proceed to do a worked example:
Step 1: Choose any two points on the line
“Let’s do that.” I’ll pick several students so that we have two or three pairs of points, say (0,15) and (2,5), (1,10), and (3,0), and (0,15) and (3,0)
Step 2: Find the rate of change between the points.
“Let’s pick two points: (0,15) and (2,5). We want the change in gallons over the change in time. The y-axis represents gallons, and the x axis represents minutes. The gallons are represented by which coordinate, the x or y?” It is obviously the y coordinate.
“Let’s find the change: 15 -5 = 10. We do the same for the change in time, but we go in the same order. The x coordinates are 0 and 2. What is 0 – 2?”
There may be some hesitance to say -2.
“It’s OK that it’s negative. We’ll see what that means. Change in gallons/change in time is 10/-2. What is 10 divided by -2?”
Hearing -5, I pronounce that the slope is -5 gallons/min. “What does the negative mean in this case? What’s happening to the amount of water in the bottle?”
I hope to hear “It’s decreasing” or equivalents to it, and I usually do.
“That decrease is represented by a slope that is negative. In this example, it means that the change in the amount of water in the bottle decreases by the same amount over the same unit of time.”
This now provides the entrée for introducing the formula for finding the slope of any line.
“We just saw that we get the same slope for any two points that we pick on the line. We computed the change in y, which gives us the rise. And we divided by the change in x, which gives us the run.”
I write the following on the board:

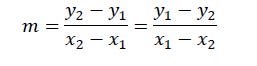
“The change in y and the change in x, we did by subtracting the y and x coordinates. So here is the formula for that, and it’s one you will use very often”:

“We use the letter m to represent slope. And we use the little numbers, called sub-scripts to refer to the two y and two x coordinates. Let’s look at the example again.”
“Let’s look at (1,10) and (2,5). To keep track of the coordinates we can do this:

“What is the value of x1?” I should hear “1”, and I then repeat this for all the coordinates until they are familiar with how the naming scheme works. “Now let’s plug these in to the formula.” I have them do this in their notebooks and check their work, providing guidance and answering questions.

I will hear some objections that the order of the numbers was different than how I did the first example.
“You’re right!” I’ll say. It doesn’t matter what order you do them in, as long as you keep the same order in the numerator and denominator. Let’s do it the opposite direction:

“So let’s modify our formula”:
Examples. We put it to work with examples; the first few of which I provide assistance as needed. Students generally catch on to it fairly quickly. A common mistake is to put the difference between the x coordinates in the numerator, and y coordinates difference in the denominator.
I point out that we don’t need to see the graph in order to find the slope. We just need to apply the formula.
1. Find the slope of the line that passes through (-4, 3) and (1,2)
Answer: 1/-5 = -1/5. I make clear that 1/-5 or -1/5 means the quotient or resulting fraction is negative, so -1/5 is how we write it.
2. (1,-5), (8,3) Answer: -8/-7= 8/7
3. (1,1), (3,5) Answer: 4/2 = 2
4. (3,4) and (2,4) Answer: 0/-1 = 0. Students think they have done something wrong. I explain that a slope of 0 means a horizontal line and we graph it to show that this is true. “Horizontal lines have a slope of zero.”
5. “How about this?” (3,4) and (3,5) Answer: 1/0 which is undefined. We graph it to show it is a vertical line. “Vertical lines have a slope that is undefined.”
For these last two I explain that we will get into more detail about horizontal and vertical lines in the next lesson.
Homework. Homework problems should consist of finding the slope of lines presented on graphs, in tables, or as a pair of points as shown in the examples. For lines on graphs, the points should be marked as we did in the examples, rather than having students find where the line intersects with grid points as is sometimes done in textbooks