

LE 3 Traditional Math: Representing Linear Functions
Accelerated seventh grade math, and Math 8

In this section we start to show how functions can be represented graphically. The “code” aspect of functions mentioned in the previous section is then taken a step further—the code helps draw a picture that makes the code obvious by seeing what y value is matched with a particular x value. To put this in a context that the class will understand (or at least pretend to) I’ve found that it helps to show that an equation such as 16 = 5x + 1 is one particular answer that satisfies the general equation y = 5x +1. When x equals 3, then y = 16. In fact, there are infinitely many such (x,y) combinations for the equation, which is the main message of this particular lesson.
In most textbooks, the fact that an infinity of ordered pairs lay on the same line is used as a means for graphing the equation. Students are directed to find three ordered pairs, plot them, and then connect them in a straight line. A subsequent lesson provides a method of graphing such equations by finding the x and y intercepts. This method works well for equations in standard form: Ax + By = C, where C does not equal zero.
Related to this method, students are presented with interpreting a situation modeled by an equation For example: “You have $6 to spend on apples and bananas. (a) Graph the equation 1.5x + 0.6y = 6, where x is the number of pounds of apples and y is the number of pounds of bananas. (b) Interpret the intercepts.” Later, students will learn about slope, the slope-intercept form of equations, and using slope and y-intercept for graphing an equation (which takes care of the situation when C equals zero).
In one textbook I was required to use, graphing by finding some ordered pairs and plotting the points, the interpretation of equations mentioned above, and the method of using x and y intercepts to graph a function were combined in one lesson. Mistakenly, I taught all of these topics and students were very confused. Therefore, I limit this lesson only to the first method which allows for various types of functions to be graphed, including equations in standard form.
Another observation: Still later, students are presented with “direct variation” which is linked to proportionality (discussed in an earlier section), and which in turn is linked to slope. As I stated before, my experience is that students find this confusing and do not necessarily make the connections that the textbook writers (and authors of Common Core math standards) hope to see. From what I’ve seen, the concept of slope is one that students, when they encounter it again in algebra more easily recall it than direct variation. I do not dwell on these concepts other than to provide very basic and explicit instruction. Rather, I work on providing a foundation that can be built upon when revisiting these concepts in a subsequent algebra course.
Warm-Ups. Included in these is a subtraction problem that students are likely to make a mistake on; work with negative numbers has to be repeated frequently.
1. Translate into an equation and solve. Three more than two times some number is 10. Answer: 3 + 2x = 11; 2x = 8; x = 4
2. In the equation y=2x + 7 find what y equals when x equals 5. Answer: y=10+7=17
3. Susan and Nancy received some money in the ratio of 2:5. Nancy received $36 more than Susan. How much money did Susan receive? (Use algebra or tape diagram to solve.) Answer: 5x=Amt of Nancy’s money; 2x = amt of Susan’s money; 5x – 2x = 36; 3x = 36; x = 12. 5x=$60, 2x=$24
4. A motorcyclist rode for 7 hours from Smallville to Metropolis at an average speed of 35 mph. A van took only 5 hours for the same trip. Find the speed of the van. (Hint: distance = speed x time; speed = distance÷time7) Answer: Distance from Smallville to Metropolis is 7 × 35 = 245 miles. Speed of van = 245÷5=49 mph
5. 32-45 = ? Answer: -13
These are mostly review problems, although Problem 4 poses difficulty for students. The hints given in the problem are what I point to when students ask about how to solve. Other prompts: “What’s the distance from Smallville to Metropolis? How do you find it? Once you know it how can you use it to find the van’s speed?” Problem 5 is included because in my experience, seventh graders forget the rules for working with negative numbers; the more such problems are repeated, the better. Problem 1 relates directly to this particular lesson.
The Wind-Up: Linear Functions and Equations. I have the class look at Problem 1 of the Warm-Ups.
“When translated, we get the equation 3+2x = 11. You then solved it and found one answer to the equation: x = 4. But if we replace the 11 on the right hand side with y we have y = 3 + 2x. Is there only one answer to the equation?”
Some might say yes. and generally argue that if you put in a value for y you will get one answer for x which is true, and I say so but not the point I was trying to make. “But if you put in a value for x you will get one answer for y. But you can put in more values for x and get more answers for y. There are many answers to this equation. What does y equal if x equals 3?”
The answer is 13 and I write (3, 9) on the board. I throw out some more numbers for them to plug in for x and end up with more ordered pairs: (2, 7), (0,3) (-2, -1).
“The equation y = 3 + 2x is a rule which assigns numbers in the domain (remember what that is? The input values, in this case x) to numbers in the range, or y. So it’s a function. In this unit, we’ll be looking at linear functions which are written as equations like the one we just worked with. If we graph this and other linear functions, we will get a straight line.
The Pitch: Graphing Linear Equations. I have them write the following in their notebooks: A linear function is a function whose graph is a nonvertical line.
“We just came up with four ordered pairs for the equation y = 3 + 2x, so let’s graph it.”
I will project graphing coordinates on the whiteboard and have a student or students graph the four points:
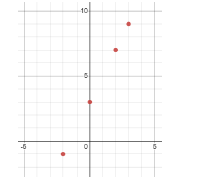
After connecting the points, we get the following graph:
I have them write the following in their notebooks: Any ordered pair on the graph of a linear function is a solution of the related equation.
“So in this case, if we pick any point on the line, it will be a solution of y = 3 + 2x. The line represents every solution to that equation.”
Graphing Equations. The above technique is used as an initial method for graphing linear equations.
“We can use this method to graph an equation. You don’t have to use four points; you can use three and still get good results. Let’s do one. y = 5x – 2”
I have them construct a table as follows:

“To make it easy on yourself, use the numbers -1, 0, and 1, substitute them for x in the equation to get y, and then write the ordered pair.” We work through the equation and end up with:

They then plot the points and connect them with a straight edge in their notebooks:

Examples. I continue with two more similar problems and then give the following:

The key here is to solve for y, to obtain 𝑦=−3𝑥+5 which they can then work as before. Students have difficulty at first with such problems. These are limited to equations where the coefficient of y is 1. This then requires only that students move the x term to the other side.
Next, I give an equation that has a fractional coefficient.

I usually have a few students who still have difficulty multiplying a whole number by a fraction. Writing the problem as 3/1 × 2/3 will usually help. The ordered pairs obtained will be (-3, -4), (0, -2) and (3, 0).
Homework. The homework is a continuation of these type of problems; students construct tables of values as shown and graph the results. The problems should include equations in standard form such as 2x + y = 3, so that they must solve for y, as well as those with fractional coefficients. Equations with larger numbers such as y = 20x + 10 will require students to label their coordinates by 5’s or 10’s to keep the resulting graph a manageable size. I usually include one or two of those in the examples, telling the students that I am selecting the problem from their homework assignment, thus leading them to believe they are going to get the answers “for free”. They aren’t!